Blog
Datasets and Dashboards in Marketing Analysis

Datasets and Dashboards in Marketing Analysis
In today's world, wherever we see, there is a lot of information everywhere. Whenever we search for something, we end up having a bunch of essential datasets. According to a report by the EMC Digital Universe, by the year 2020, around 40 trillion megabytes or 40 zettabytes will grab the place in the digital world.
Sometimes, these data and information should have a proper way of representation because they help measure business health. Upon the datasets, there depends the responsibility of taking further steps to execute the operation. Here comes the use of Dashboards in marketing and business analysis.

All you need to know
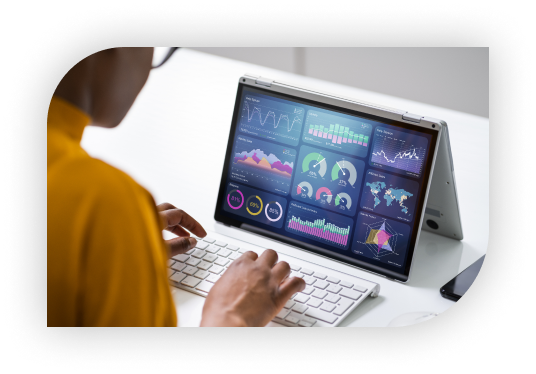
A data dashboard is a necessary tool that serves a vital role in information management. It provides a visual representation of the key performance indicators (KPI), metrics, and other fundamental data points to the user.
A data dashboard offers a centralized and interactive way of business analytics. It monitors, measures, does in-depth analysis, and finally extracts relevant business and marketing insights from a varied range of datasets in vital areas of the action. After all the back-end operations, it displays all the information collected intuitively and interactively.
The role of dashboards in marketing analysis

A data dashboard has immense abilities to distribute the datasets based on the specific requirements, targets, and strategies.
When a dashboard starts its operation, at first, it collects the raw data from several sources. Before presenting it visually through the customized dashboard, the data dashboard provides the organization's most valuable data, encouraging the user to find a reliable and suitable action.
The data dashboard is often linked to some specific KPIs and metrics that define the business goals. This helps the user to extract collective information by creating benchmarks and measuring the analytics continually. Thus, an appropriately designed data dashboard offers a data-driven project model that results in more success and growth in the business.
How does a data dashboard work?
There are several kinds of data dashboards used in organizations. Although they work in different ways, the elemental work principle is the same for all of them. The best data dashboards are designed to provide the necessary answers to the most critical questions regarding the business through quick yet thorough research and in-depth analysis.
First, you need to know the user database and the target audience. Know their character and behavior well. Create a vision about what features should be included to enhance the strategy. Then, you need to find out the relevant and meaningful metrics and draw some critical insights from them. Then, go ahead to figure out the real problem and take the necessary decisions for the analysis. The next step includes making an appropriate chart. This is a crucial step as choosing the type of charts to display the datasets creates a long and profound impact on the audience's minds. This further helps in the interpretation of the information.
The analyst should undergo several rounds of experiments and minutely explore various types of charts to discover the best one to display the insights derived from the datasets.
Some familiar and easily predictable chart types are bar charts, pie charts, line charts, and tables with highlights.

After making the most appropriate chart, you need to add some valuable texts inside the charts. The chart should have a suitable title that includes brief details about the metrics, the categories, and the measures displayed. The color used in the charts is needed to be chosen very carefully to empower the customer to take action effectively.
Some of the best dashboards examples
We have been talking about datasets and dashboards for a long since we started the discussion. So, now let's dive deeper into the best data dashboards that are designed oriented to serve various business sectors and industries.

Management Dashboards
One of the most used data dashboard templates is a management dashboard. It is a "higher level" kind of dashboard that is designed especially for a C-level executive. This dashboard is focused on some vital management KPIs like the number of new potential customers compared to targets, the average amount of revenue per customer, the customer acquisition cost, target revenue, gross revenue, and last year's revenue.

Web Analytics Dashboard
A social media influencer always wants to utilize digital marketing broadly in the business. For this purpose, this kind of marketing dashboard serves best. It is designed with a focus on web analytics. This dashboard will provide the users all the substantial visualizations to have a deeper insight and examine all web-related data relevant to marketing purposes. These kinds of data dashboards give the user easy access to several necessary marketing KPIs. This bunch of information makes it an easy task to know where the user should prioritize his expertise, in which field he should invest more time and energy.

Human Resources Data Dashboard
HR is one of the most data-driven and trending software solutions. Nowadays, HR plays a pivotal role in making recruitment and talent acquisition operations more effective, with a keen eye for quality. In a modern HR dashboard, the main focus is on talent management. It helps professionals identify issues and potential impacts on the business by providing an in-depth analysis emphasizing essential metrics related to hiring talented candidates.

Sales Cycle Length Dashboard
The sales dashboard is a vital dashboard for a sales manager. This kind of dashboard helps the user to break down the data analysis. It expands the analytics by showing how the sales managers are performing differently compared to each other. It further helps in providing deeper insight by breaking down the sales KPIs into several parts showing how many salespersons are holding onto each step.

IT Data Analytics Dashboard
In the IT industry, a dashboard serves a high purpose and holds an extreme value. It's one of the most used tools needed to ensure projects will be delivered on time, especially for the chief technology professionals who need to be updated with an overview of the strategic management to lead the technological resources in purpose with business goals. So, this kind of dashboard helps to centralize all the individual segments that hold meaningful value for leaders. It also provides the IT professionals the necessary advancements of the company.

Logistics Transportation Dashboard
This kind of data dashboard helps understand how big data and data analytics can impact the logistics industry. Especially in logistics, data derived in every moment matters as the user wants to process as many deliveries as possible. This specific kind of dashboards helps in providing easy access to adjust the employee performance. It also helps to give insights into the overall transportation performance since the delivery is queued, work efficiency, average loading time, and some other logistics metrics. They will enable the analysts to generate necessary actions by examining various details and identifying trends in the transportation management processes.
Benefits of dashboards in Marketing Analysis
The analysts use data dashboards to display the extracted datasets, the derived insights, and the results collected from all the sources. These outcomes are then used as an interactive visual representation and databases and spreadsheets to create tables, pie charts, line charts, bar charts, etc. These are collectively saved and displayed on the business data dashboards where the users can easily find the measures and understand the key performance metrics they are searching for in operation.
Data dashboard also helps in performance management as it provides an overview of how the departments are working individually to meet their goals. Sometimes, scorecards are created based on the employee's performance, and they help boost their energy level to work with motivation.
It's also needed to offer access to future goals. Displaying the metrics related to the organization's growth and success, a dashboard helps in providing a clear vision board to the analysts.

Data dashboards can help in the progress of the business in a significant way. They need to be updated on a weekly or monthly, or sometimes, yearly basis. They are intended to create reports by allowing the users to fetch the necessary information whenever needed, without waiting for hours to finish the calculations and analysis. In this way, the organization can have a clear vision of the progress of the business.