Tableau: Leading Business Analytics Company in San Francisco
Tableau Business Analytics is a powerful data visualization and business intelligence tool that helps organizations analyze and understand their data. At Lateral Matrix, we specialize in providing expert guidance and support to companies in leveraging Tableau's capabilities. Our team of skilled professionals assists in implementing Tableau, creating interactive dashboards, and extracting valuable insights to drive informed decision-making and improve business performance.

Why Business Needs Tableau Business Analytics Services
Are you a business owner in San Francisco looking to gain a competitive edge in the market? If so, then you need to consider utilizing Tableau Business Analytics Services for your business. Tableau is a powerful data visualization and business intelligence tool that can revolutionize the way you analyze and interpret your company's data. With Tableau, you can easily connect to various data sources, whether it's your CRM system, spreadsheets, or even cloud-based platforms. This allows you to gather all your data in one place and gain a comprehensive view of your business performance. Tableau's intuitive and user-friendly interface makes it easy for anyone in your organization to create interactive dashboards and reports, without the need for extensive technical skills. By leveraging Tableau's advanced analytics capabilities, you can uncover valuable insights and trends hidden within your data. This will enable you to make data-driven decisions, identify areas for improvement, and optimize your business processes. Additionally, Tableau's ability to create visually appealing and interactive visualizations will help you effectively communicate your findings to stakeholders and clients. In the competitive business landscape of San Francisco, having access to accurate and timely data is crucial for success. Tableau Business Analytics Services can provide you with the tools and expertise needed to transform your data into actionable insights, giving you a significant advantage over your competitors. Don't miss out on this opportunity to take your business to the next level.
Our Tableau Business Analytics Services
Tableau Desktop
This is the primary tool used by business analysts to create interactive visualizations and dashboards. With Tableau Desktop, you can connect to various data sources, manipulate and transform data, and design visually appealing charts and graphs.
Tableau Server
Tableau Server allows you to publish and share your Tableau workbooks and dashboards with others in your organization. It provides a centralized platform for collaboration, data governance, and access control. You can also schedule data refreshes and automate report distribution using Tableau Server.
Tableau Online
Similar to Tableau Server, Tableau Online is a cloud-based platform that allows you to publish and share your Tableau content over the internet. It offers the same features as Tableau Server but eliminates the need for on-premises infrastructure and maintenance.
Tableau Prep
Tableau Prep is a data preparation tool that helps you clean, shape, and combine data for analysis. It provides a visual interface for performing data transformations, such as filtering, pivoting, and joining, without the need for complex coding or scripting.
Tableau Mobile
Tableau Mobile is a mobile app that allows you to access and interact with your Tableau dashboards on smartphones and tablets. It provides a responsive and touch-friendly interface, enabling you to explore data and make data-driven decisions on the go.
Tableau Public
Tableau Public is a free platform that allows you to publish your Tableau visualizations to the web for public consumption. It is a great way to showcase your data storytelling skills and engage with a wider audience. However, keep in mind that data published on Tableau Public is accessible to anyone and cannot be restricted to specific users or organizations.
Features of Tableau Business Analytics
Interactive dashboards
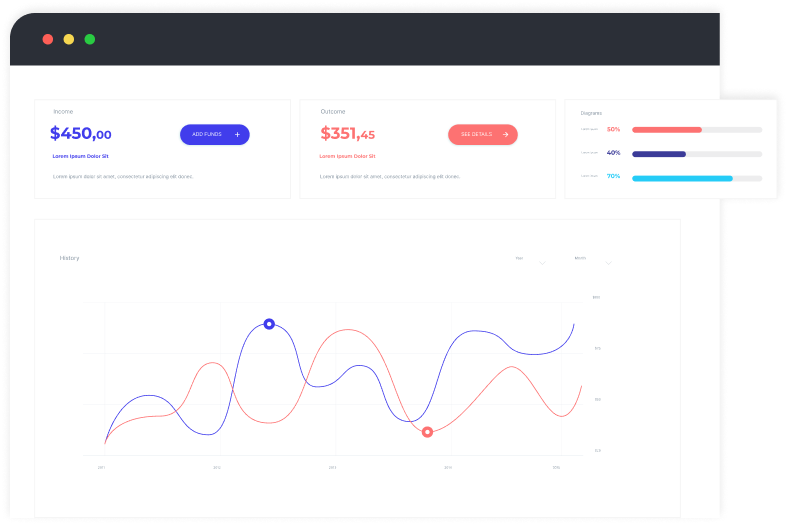
Tableau allows users to create interactive dashboards that can be customized and updated in real-time. This feature enables users to explore data and gain insights quickly and easily.
Data visualization
Tableau offers a wide range of visualization options, including charts, graphs, maps, and more. These visualizations help users understand complex data sets and communicate insights effectively.
Data blending
Tableau allows users to combine data from multiple sources and blend them together for analysis. This feature enables users to gain a comprehensive view of their data and uncover hidden patterns and relationships.
Advanced analytics
Tableau provides advanced analytics capabilities, such as statistical modeling, forecasting, and clustering. These features allow users to perform in-depth analysis and make data-driven decisions.
Collaboration and sharing
Tableau allows users to collaborate with others by sharing dashboards, reports, and data sets. This feature promotes teamwork and enables users to work together on data analysis projects.
Mobile accessibility
Tableau offers mobile apps that allow users to access and interact with their dashboards and reports on the go. This feature enables users to stay connected and make data-driven decisions anytime, anywhere.
Data storytelling
Tableau provides tools for creating compelling data stories that combine data visualizations, text, and images. This feature helps users communicate insights effectively and engage their audience.
Start Your Tableau Business Analytics Process With Us
Why Choose Our Tableau Business Analytics Company San Francisco

You're looking for a data analytics company in Texas, and you want to make sure you choose the right one. Well, look no further than our company. Here's why:
- Expertise in Tableau: Lateral Matrix is a leading Tableau Business Analytics Company in San Francisco, known for its deep expertise in Tableau software. With a team of highly skilled professionals, we have a thorough understanding of Tableau's functionalities and can provide customized solutions to meet your business needs.
- Data-driven decision-making: We understand the importance of data-driven decision-making in today's competitive business landscape. Our Tableau Business Analytics solutions enable you to analyze and visualize your data in a meaningful way, empowering you to make informed decisions that drive business growth and success.
- Advanced analytics capabilities: Lateral Matrix goes beyond basic data visualization and offers advanced analytics capabilities through Tableau. Our team can help you uncover hidden insights, identify trends, and predict future outcomes using advanced statistical techniques and machine learning algorithms.
- Local presence in San Francisco: Being based in San Francisco, we have a strong understanding of the local business environment and can provide tailored solutions that align with the unique needs of businesses in the area. Our proximity allows for seamless communication and collaboration, ensuring a smooth implementation of Tableau Business Analytics solutions.
1200+
Product Delivered
8+
Years Of Experience
200+
Experts
List of Industry Require Data Analytics Services

Retail and E-commerce

Healthcare

Finance and Banking

Manufacturing

Telecommunications

Energy and Utilities
Transportation and Logistics

Government and Public Sector

Media and Entertainment

Education and Research

Hospitality and Tourism

Agriculture and Farming

Real Estate and Construction

Insurance

Sports and Fitness
Our Tableau Business Analytics Service Process
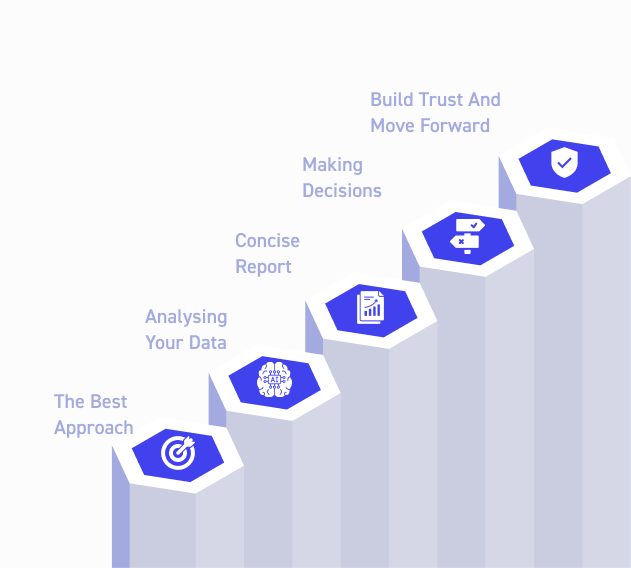
- Introduction: Begin by introducing the Tableau Business Analytics Service and its importance in helping businesses make data-driven decisions. Highlight the benefits of using Tableau for business analytics, such as improved efficiency, better decision-making, and increased profitability.
- Data Gathering: Explain the first step in the Tableau Business Analytics Service process, which involves gathering relevant data from various sources. Discuss the importance of collecting accurate and comprehensive data to ensure the effectiveness of the analytics process. Mention different data sources that can be utilized, such as databases, spreadsheets, and cloud storage.
- Data Preparation: Describe the next stage of the process, which involves cleaning and transforming the collected data to make it suitable for analysis. Discuss the challenges associated with data preparation, such as missing values, inconsistencies, and data format issues. Highlight how Tableau's data preparation tools can simplify this process and ensure data quality.
- Data Analysis and Visualization: Explain how Tableau's powerful analytics capabilities can be utilized to analyze the prepared data and derive meaningful insights. Discuss the various analysis techniques that Tableau offers, such as statistical analysis, forecasting, and trend identification. Emphasize the importance of visualizing the data using charts, graphs, and dashboards to make it easier for stakeholders to understand and interpret.
- Reporting and Decision-Making: Conclude by discussing the final stage of the Tableau Business Analytics Service process, which involves generating reports and presenting the analyzed data to stakeholders. Explain how Tableau's reporting features enable the creation of interactive and dynamic reports that can be customized based on the specific needs of different stakeholders. Highlight how these reports facilitate informed decision-making and drive business growth.


Our Technology
- Tableau Desktop
- Tableau Server
- Tableau Prep
- Tableau Public
- Tableau Mobile
- Tableau Online
- Tableau Bridge
- Tableau Catalog
- Tableau Data Management Add-on
- Tableau CRM Integration
Essential Performance Indicators for Tableau Business Analytics
- Revenue growth
- Client satisfaction rating
- Number of new clients acquired
- Retention rate of existing clients
- Average project completion time
- Number of successful data visualization projects
- Return on investment for clients
- Employee productivity and efficiency
- Number of industry awards and recognition received
- Overall profitability of the agency

Testimonials

If you're looking for top-notch business analytics services in San Francisco, look no further than Lateral Matrix. They have a team of experts who specialize in Tableau, ensuring that you get the most out of your data. With their help, we were able to uncover valuable insights and make data-driven decisions that significantly improved our business performance.
Lateral Matrix's Tableau business analytics services in San Francisco are a game-changer. Their team not only has a deep understanding of Tableau but also possesses extensive knowledge of various industries. They tailored their solutions to our specific needs, providing us with actionable insights that helped us streamline our operations and boost our bottom line.
Choosing Lateral Matrix for Tableau business analytics services in San Francisco was one of the best decisions we made for our company. Their expertise in data visualization and analysis allowed us to transform complex data into clear and concise visualizations, making it easier for our team to understand and act upon. Thanks to their services, we were able to optimize our processes and achieve remarkable growth.
Case Study
Are you a business owner in San Francisco looking to gain valuable insights from your data
Look no further than Tableau Business Analytics Services! With our cutting-edge tools and expertise, we can help you unlock the true potential of your data and make informed decisions for your business.
Imagine being able to visualize your data like never before. With Tableau Business Analytics Services in San Francisco, you can transform complex data sets into interactive dashboards and reports that are easy to understand and analyze. Whether you're in retail, finance, or any other industry, our team of experts will work closely with you to tailor our services to your specific needs.
Tired of spending hours manually crunching numbers and creating reports
Let Tableau Business Analytics Services in San Francisco automate the process for you. Our advanced analytics tools can streamline your data analysis, allowing you to focus on what really matters – growing your business. Say goodbye to tedious tasks and hello to actionable insights with Tableau.